


Concept
The goal was a device that monitors air quality, needs no controls for normal operation and can be operated and configured from a phone or a PC. For this purpose I chose a ready-made microcomputer module, the Waveshare ESP32-S3-ePaper-1.54: an e-paper display with an integrated microcontroller and supporting circuits built into a compact plastic case. The module has a 200 × 200 pixel black-and-white display, a built-in FT6336 touch controller, a PCF85063 real-time clock, an ES8311 audio codec and an SD card slot. It contains almost everything except the sensors themselves. These, together with their supporting circuits, are on a separate printed circuit board into which the module is plugged.
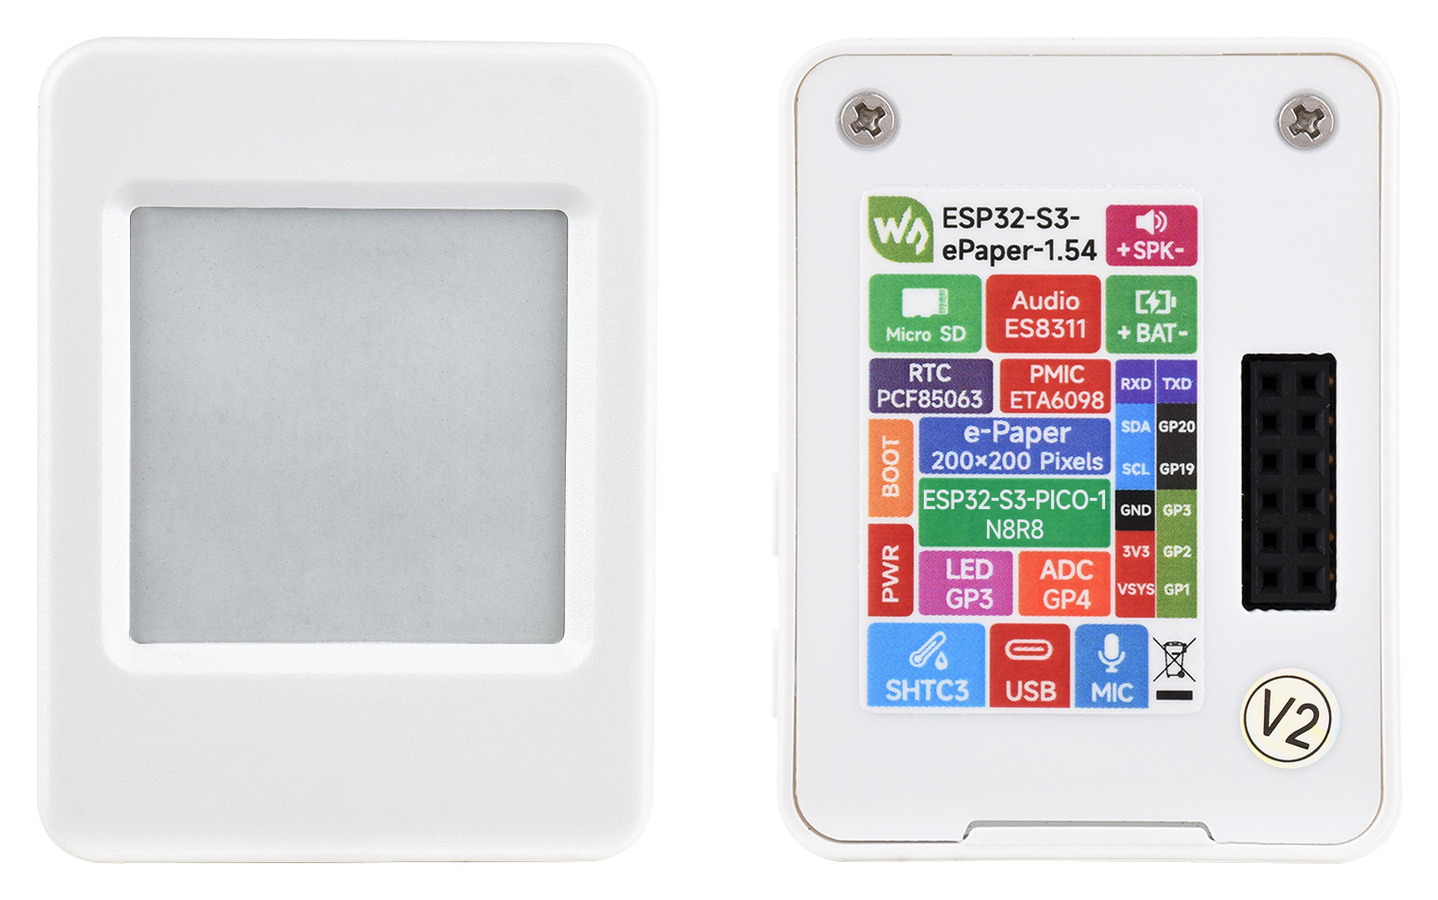
Fig. 1 – The Waveshare ESP32-S3-ePaper-1.54 module: front and rear view with the pin labels (photo: Waveshare)
The main sensor is a module with a Bosch BME688 sensor. It measures temperature, relative humidity, pressure and the resistance of the gas sensor, from which the firmware calculates the indoor air quality index IAQ (0 to 500, with a verbal rating from “Excellent” to “Dangerous” in six categories determined by the software). The additional sensor is the MQ-4 for methane and natural gas. It is optional and has its own switched supply branch, so it can be switched off completely in the settings (the reason for being able to switch it off is its higher power consumption).
| Part | Component | Role |
| Control module | Waveshare ESP32-S3-ePaper-1.54 | processor, Wi-Fi, display, touch, RTC, audio, SD |
| Air sensor | Bosch BME688 (I2C, address 0x77) | T, RH, p, gas resistance, IAQ |
| Gas sensor | MQ-4 (analogue output) | methane / flammable gases in ppm |
| Power | +5 V, connector USB1 or terminal X1 | only one of them at a time |
I added the MQ-4 sensor for an independent detection of natural gas, possibly propane-butane or similar gases it is designed for and can detect, because my old ionisation sensor had given up. I used it as a safety sensor for detecting a natural gas leak, in parallel with the results given by the BME688, in case the BME688 measurement fails.
Hardware and mechanical design
Circuit diagram
The circuit diagram of the device is in Fig. 2. It is simple, because most of the work is done by the software of the ready-made ESP32-S3 module and the sensors are on separate modules. This simplifies the construction and lets me concentrate on the functionality instead of on supporting circuits already solved by the modules. The circuit only provides the power input, its filtering, a power switch for the MQ-4 sensor, a voltage divider for its analogue output so that the levels are compatible with the ESP32 input, and connectors for the modules.
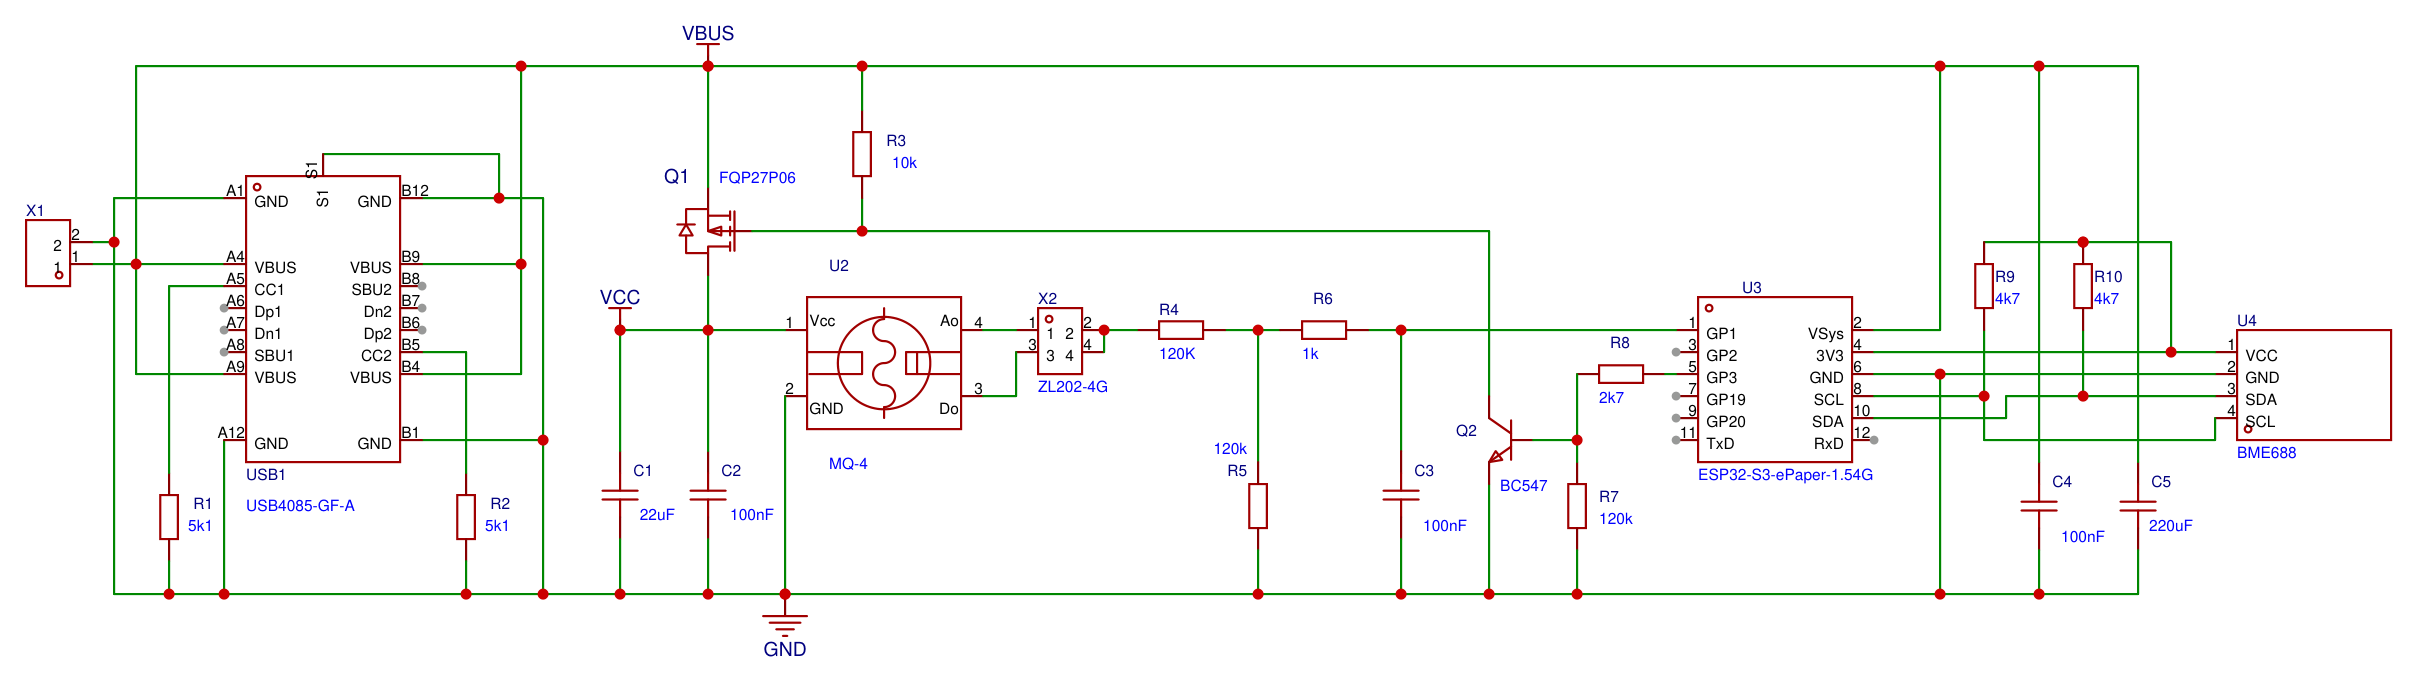
Fig. 2 – Circuit diagram of the main board (version 1.3): USB1 and X1 power input, switch Q1 and Q2 for the MQ-4 (U2), divider R4 and R5 with filter R6 and C3, ESP32-S3-ePaper-1.54 module (U3) and BME688 module (U4)
The device is powered from a single +5 V supply. It can be fed through the USB-C connector (USB1) or the screw terminal X1; both inputs are connected in parallel on the board, so using both at the same time is not recommended. The USB-C connector is used for power only, the data lines are not used. Resistors R1 and R2 (5.1 kΩ each) on the CC1 and CC2 pins of connector USB1 tell the power source that the connected device is a load, so the source puts 5 V on VBUS. These resistors ensure the correct supply voltage when a universal smart power adapter capable of delivering higher voltages is used. If you power the device from an ordinary 5 V supply (for example one with a USB-A output, or a supply connected to terminal X1), resistors R1 and R2 do not need to be fitted. If R1 and R2 are not fitted and a smart USB-C charger is connected, no supply voltage appears on the VBUS line of the connector, because the charger cannot initialise. The VBUS voltage goes directly to the VSys input of module U3, which generates 3.3 V from it for its own circuits and for the BME688 module. The supply is protected against interference by capacitors C4 (100 nF) and C5 (220 µF).
The MQ-4 gas sensor has a heated element that draws the largest part of the current of the whole device and is a source of waste heat. Its VCC supply is therefore switched by transistor Q1 (P-MOSFET FQP27P06 in a TO-220 package) connected in the positive +5 V branch. The gate of Q1 is held at the VBUS level by resistor R3 (10 kΩ), so Q1 is off. The gate is switched by transistor Q2 (BC547), whose base is connected through resistor R8 (2.7 kΩ) to the GP3 output of module U3. When the firmware sets GP3 to logic 1, Q2 pulls the gate of Q1 to ground, Q1 turns on and the MQ-4 is powered. Resistor R7 (120 kΩ) between the base and ground keeps Q2 off even during processor start-up, when the state of the GP3 output is not yet defined. The sensor supply is filtered by capacitors C1 (22 µF) and C2 (100 nF). Thanks to this switch the MQ-4 can be switched off completely in the settings, and when the ESP32 module is powered from its built-in battery the firmware switches it off by itself, because the MQ-4 output values depend strongly on the supply voltage; with a battery whose voltage is below 4 V and falls below 3 V, the sensor output values would be very hard to compensate in software, given the non-linearity of the sensor. Simply put, the MQ-4 needs a supply voltage as close to 5 V as possible. Transistor Q1 does not significantly affect the supply voltage of the MQ-4 module, because in the on state the voltage drop across it is below 20 mV.
At a 5 V supply the analogue output AO of the MQ-4 module reaches up to about 4 V, which is more than the safe voltage that can be applied to the A/D converter input of the ESP32-S3. The output voltage of the MQ-4 sensor is therefore fed to the ESP32 input through the resistor divider R4 and R5 (120 kΩ each). The signal then goes through a filter R6 (1 kΩ) and C3 (100 nF), which suppresses noise, to input GP1 of module U3 (ESP32). The divider ratio (1:2) is fixed and the firmware relies on this value. The jumper on header X2 selects which pin of the MQ-4 module is routed to the divider. On most modules the analogue output AO is on pin 4, but some manufacturers have the digital and analogue outputs swapped, so on some modules AO is on pin 3, although the modules look the same from the outside.
The BME688 module (U4) communicates with the processor over the I2C bus (SDA and SCL on pins 10 and 8 of module U3) and is powered from the 3.3 V output of the module. The SDA and SCL lines of the I2C bus have pull-up resistors R9 and R10 (4.7 kΩ each) connected to the 3.3 V supply of the module. The ESP32 module with the display, U3, plugs into a 12-pin header and is fixed to the printed circuit board from below with two M2 screws. Of its pins the board uses only the supply (VSys), ground (GND), the 3.3 V supply for the I2C module, the I2C signals (pins 10 and 8) and pins GP1 and GP3 for the MQ-4. The touch controller of the display, the real-time clock, the audio codec and the SD card slot are part of the module, so there are no other circuits on the printed circuit board (PCB).
The main PCB is built into a narrow case with ventilation openings and is intended for vertical mounting. This arrangement is neither accidental nor motivated by aesthetics: the display and especially the MQ-4 sensor get considerably warm, and if the BME688 were placed next to them or above them, the heat they produce would distort the temperature measurement. The MQ-4 is therefore in the upper part of the case (as the main source of waste heat) and the BME688 in the lower part, and the heat from the display and the gas sensor rises and leaves through the ventilation slots in the upper edge of the plastic case. With any mounting position other than vertical this arrangement loses its meaning and the temperature measurement may be distorted. The case hangs on a single screw through a keyhole-shaped opening in the rear cover. Despite this arrangement, the effect of waste heat on the temperature measured by the BME688 is about 1 °C at 25 °C. This effect is compensated in software and, of course, applies only to this particular hardware arrangement.
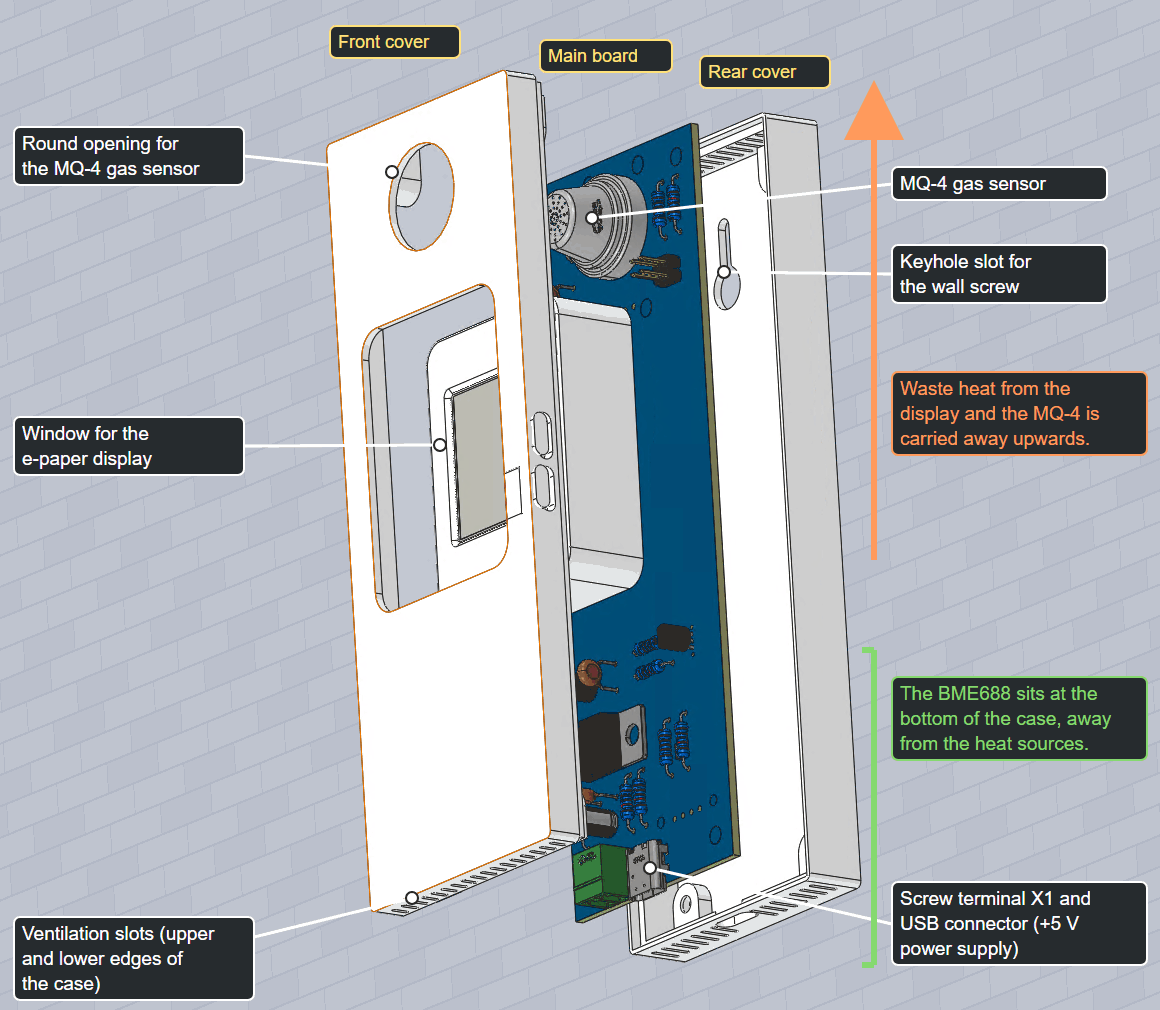
Fig. 3 – Exploded view of the case: front cover, main board and rear cover; MQ-4 at the top, BME688 at the bottom, power input (USB1 and terminal X1) on the lower edge
Printed circuit board
The printed circuit board (version 1.3) is double-sided and measures 138 × 48 mm. It is designed so that it can be populated exclusively with through-hole (THT) components, even in amateur conditions. The layout follows from the position in the case: the board stands upright in it (the reasons are given above), connectors USB1 and X1 are on the lower edge, the BME688 module is at the bottom and the MQ-4 at the top. The module with the display, U3, plugs into the large cut-out in the middle of the board.
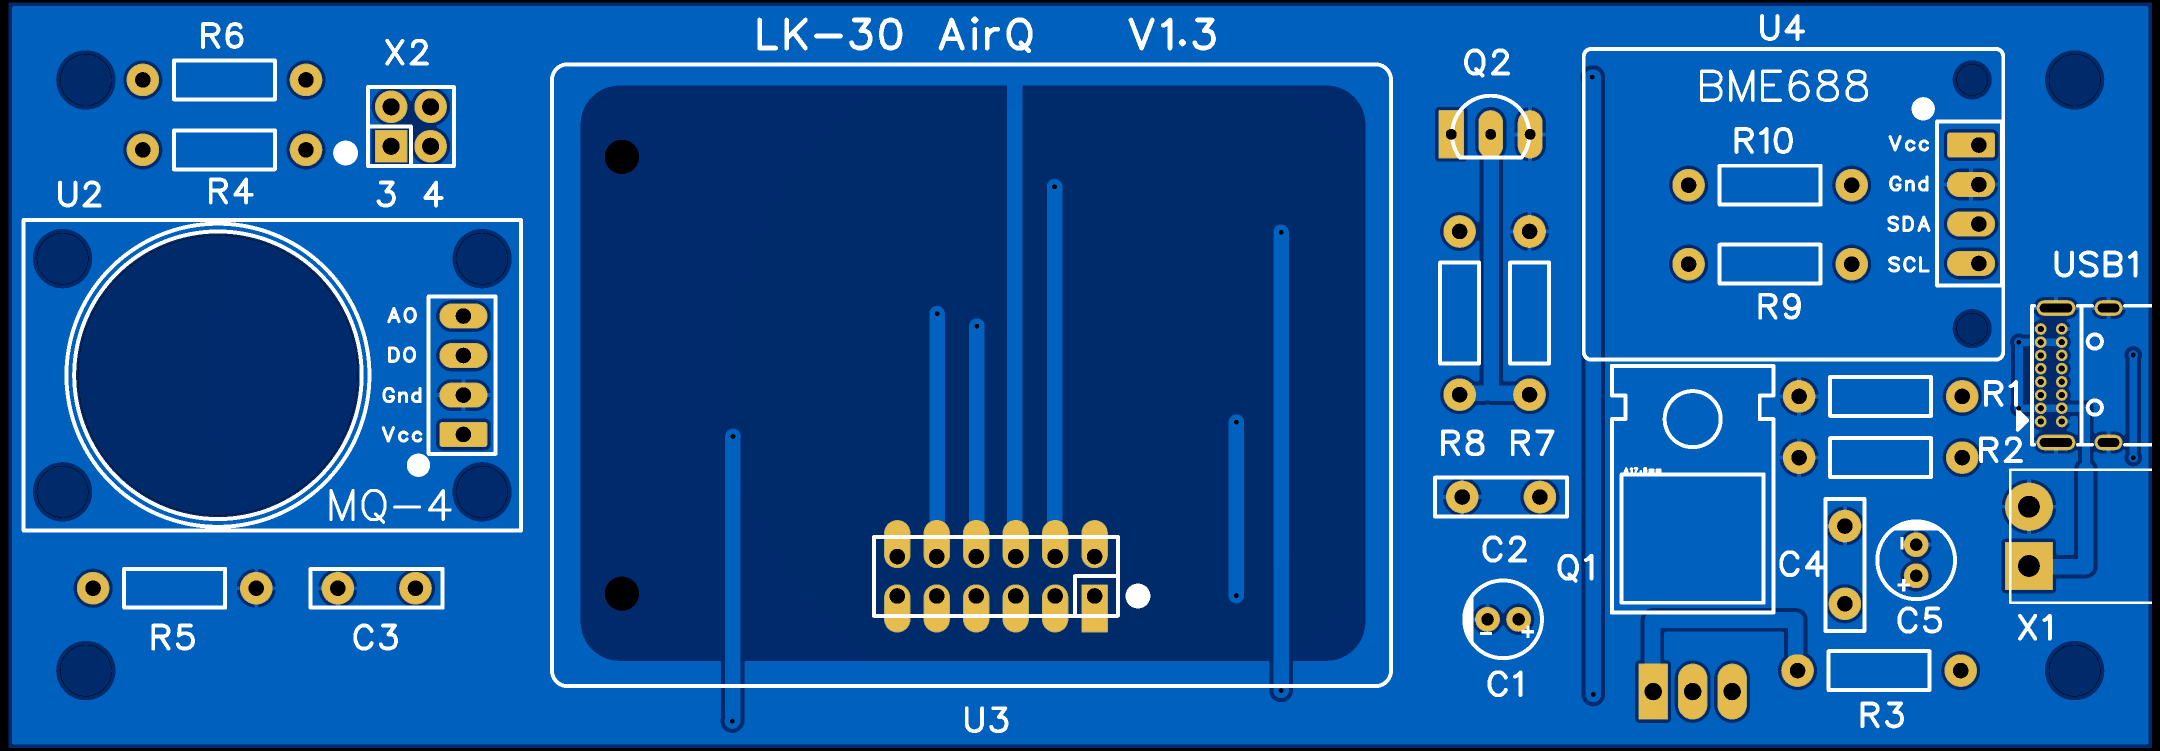
Fig. 4 – Printed circuit board (version 1.3): top view, the copper pattern of both sides and the component legend
The assembly plan (Fig. 5) shows the position of all components. On the left is the MQ-4 module (U2), above it resistors R4 and R6 and header X2, below it R5 and C3. In the middle is the space with the header for the ESP32-S3 module with the display (U3). At the top right is the BME688 module (U4), below which resistors R9 and R10 are fitted, and further down the switching circuit: transistor Q2 with resistors R7 and R8, transistor Q1 in a TO-220 package lying flat on the board (because of the height), capacitors C1 and C2 and resistor R3. Furthest right are the power inputs: connector USB1, terminal X1, resistors R1 and R2 and capacitors C4 and C5.
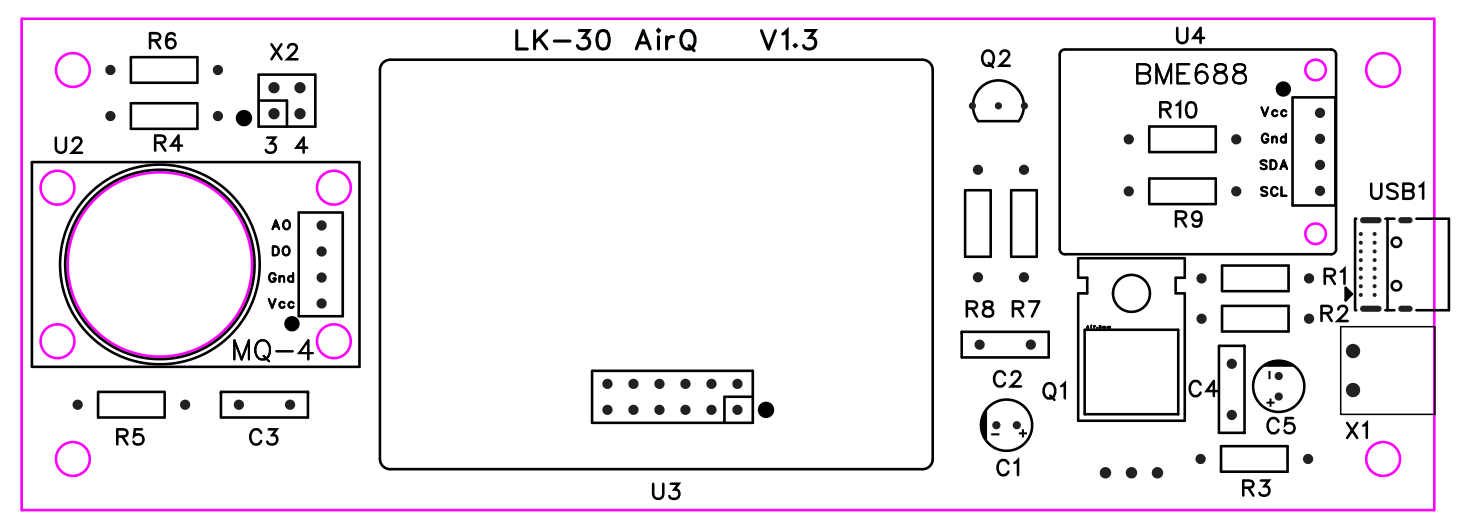
Fig. 5 – Assembly plan of the printed circuit board (version 1.3)
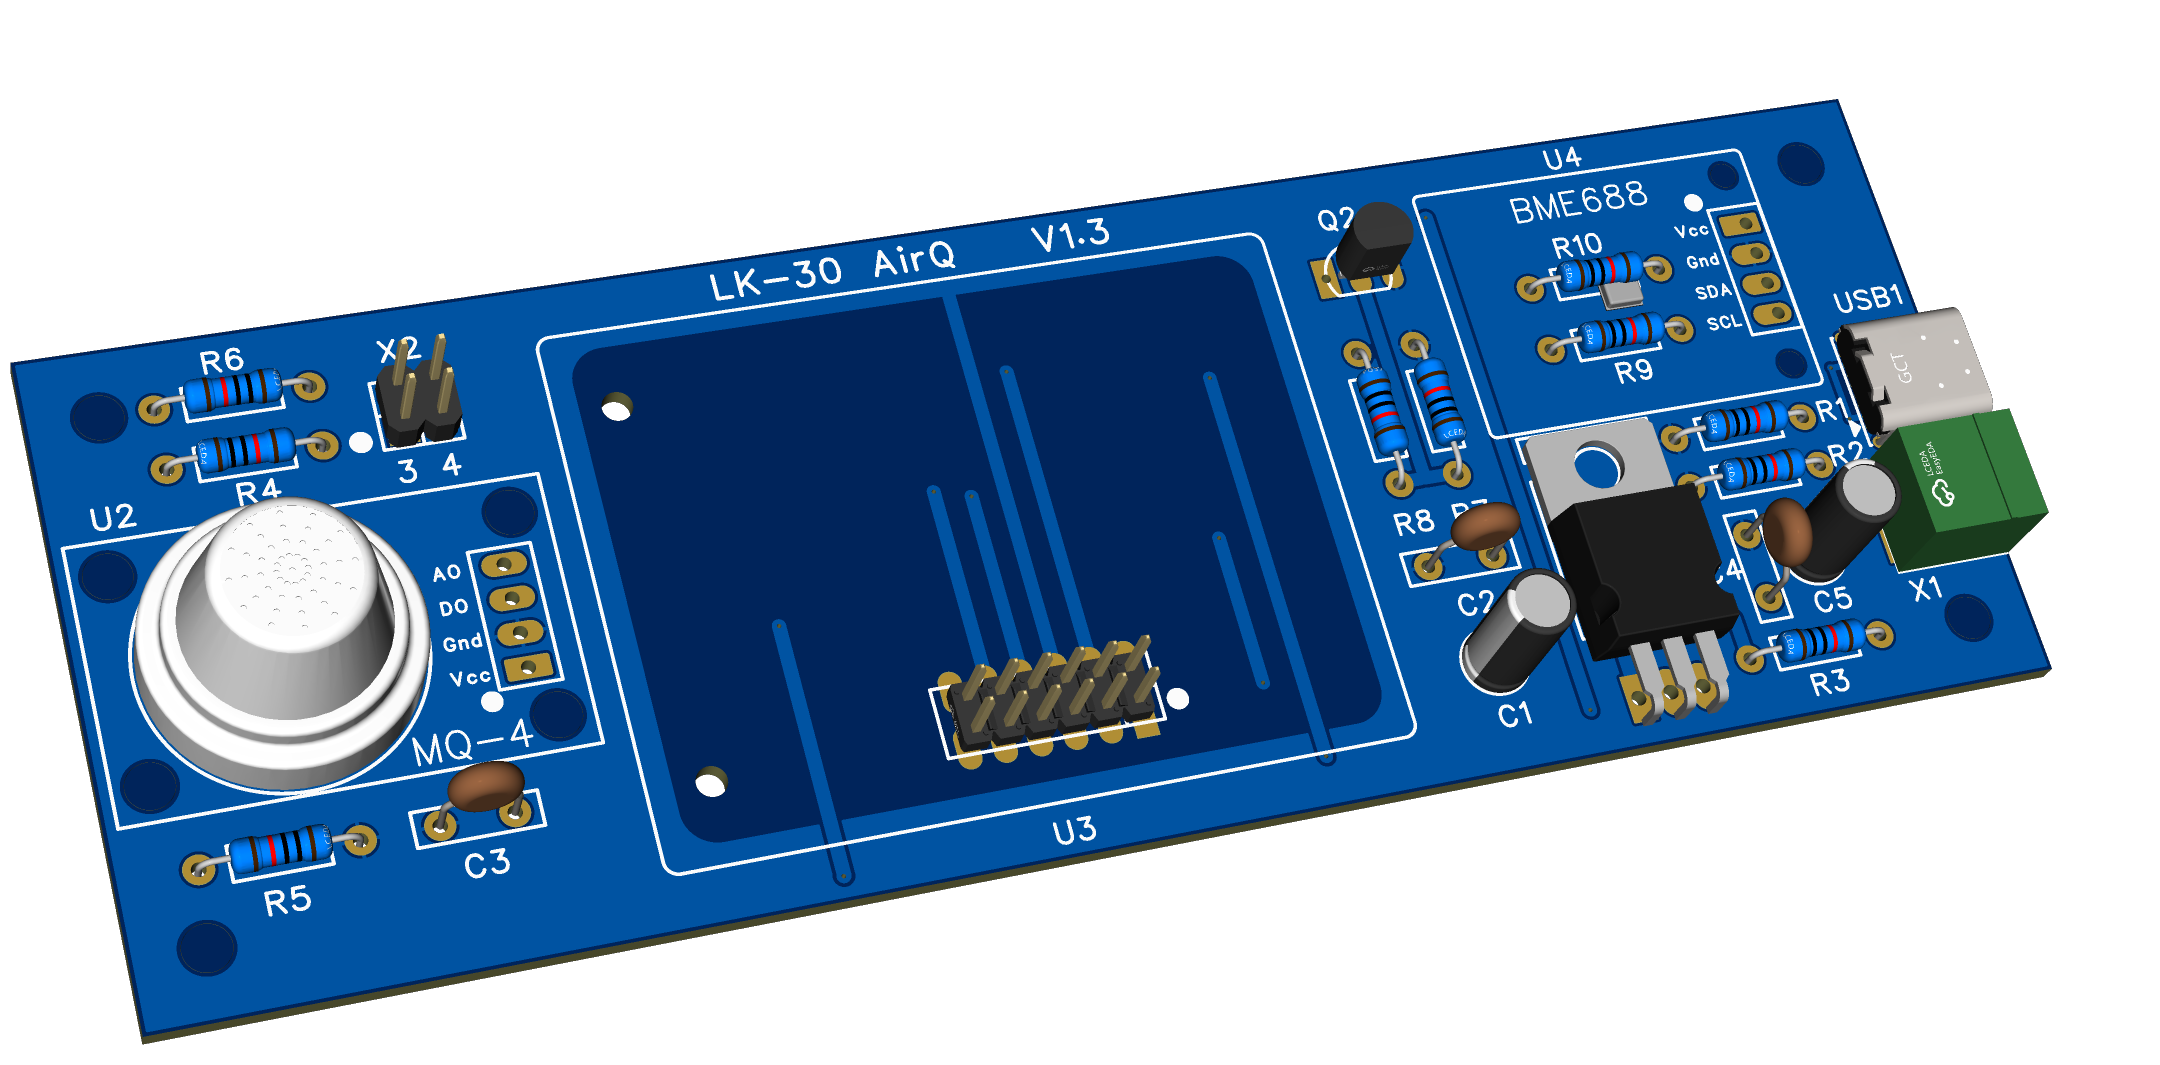
Fig. 6 – 3D model of the populated printed circuit board
The bill of materials is in the table.
| Reference | Value / type | Function |
| C1, C5 | 22 µF, 220 µF (electrolytic) | decoupling of the MQ-4 supply and of the VBUS input |
| C2, C3, C4 | 100 nF | decoupling, ADC input filter |
| Q1 | FQP27P06 (P-MOSFET, TO-220) | MQ-4 power switch |
| Q2 | BC547 | gate driver for Q1 |
| R1, R2 | 5.1 kΩ | CC1 and CC2 resistors for USB-C |
| R3 | 10 kΩ | gate of Q1 to VBUS |
| R4, R5, R7 | 120 kΩ | AO divider (R4, R5), base of Q2 to ground (R7) |
| R6 | 1 kΩ | ADC input filter |
| R8 | 2.7 kΩ | base of Q2 from GP3 |
| R9, R10 | 4.7 kΩ | pull-up resistors of SDA and SCL (I2C) to 3.3 V |
| U2 | MQ-4 module | gas sensor |
| U3 | Waveshare ESP32-S3-ePaper-1.54G | control module with display |
| U4 | BME688 module | T, RH, p, gas sensor |
| USB1, X1, X2 | USB-C (USB4085-GF-A), terminal block TBW-5-2P/GN, 2x2 header | power, selection of the MQ-4 output |
Firmware
The firmware is written in MicroPython (v1.28.0 for the ESP32-S3 with octal SPIRAM). It is divided into small modules: the BME688 driver, the e-paper display driver, touch, Wi-Fi management, an HTTP server with HTML pages, SD card management and others. All input/output pins are defined in a single configuration file, so any hardware change only means changing values in one place.
The first upload is done over USB, by connecting to the connector of the ESP32-S3 module with the display, using the Thonny program (or another suitable tool): first MicroPython is flashed and then the device files. Later versions are installed directly through the web interface from a ZIP file or from the internet; neither Thonny nor a USB connection is needed any more.
Firmware update over the web (OTA)
The device is meant to hang on a wall, and it is not convenient to take it down and connect it to a computer over USB for every firmware change. New firmware versions are therefore installed through the “Firmware update” web page (address /ota), which is served by the device itself. The source can be a ZIP package stored on the computer, or a package downloaded from a server on the internet.
Package. The package is named LK30_v<version>_<number>.zip (for example LK30_v18_432.zip). Besides the firmware files it contains a service file ota_project.json identifying the project. The device checks it before unpacking. If the target of the package (ota_target) is not LK30, the program refuses the update, so firmware from another device cannot be installed by mistake. In differential mode the package also contains a list of files (ota_diff_manifest.json).
Download from the internet. The address of the folder with the packages is stored in the configuration file config.py (FIRMWARE_URL). The web server does not list the directory contents, so the folder contains a text list versions.txt with the package names. The device reads it over HTTPS, accepts only names of the form LK30_v<digits>.zip and offers them in a selection list, the newest version on top. A package name can also be entered manually, but it must be a plain name without slashes, so the request can never be directed to another server or path. The file is downloaded using HTTP/1.0 (at most 5 redirects) and written straight to storage in 2 KB pieces; the content type, completeness and ZIP structure are checked, as well as the free space, and the whole download has a limit of 240 s. Before the encrypted connection (TLS) a contiguous free memory block of at least 70 KB must be available, otherwise the device asks for a restart.
Differential update. An ordinary firmware change modifies only a few files, while the whole package is about 1.7 MB and contains roughly 90 files. Differential mode is therefore the default: the device skips files that are already installed and unchanged. The comparison uses the record in the manifest from the previous update, the size and time of the file, and optionally the CRC32 checksum. When a ZIP file is uploaded from a computer, the browser selects the changed files and uploads only those. Full mode overwrites everything.
The update itself proceeds in these steps:
- Check. the device refuses the update if a serial line is open (for example from Thonny) or if fingerprint sample collection is running; both would disturb the writing,
- Settings backup. about 160 user values from
config.pyare saved to the fileconfig.json, - Reading the package. the list of files in the ZIP is read and the target of the package is verified,
- Unpacking one file at a time. each file is unpacked (DEFLATE) in 1 KB blocks into a temporary file with the extension
.newand immediately renamed to its original name, so flash space for only one additional file is needed. User data files (Wi-Fi settings, BME688 samples and events, sensor lifetime counters) are never overwritten, - Settings restore. the saved values are written into the new
config.py, only for variables that still exist in it; new default values from the firmware are kept, - Clean-up and restart. files that are no longer in the package are deleted (except
boot.py,ota.pyand persistent files), the new manifest is saved and the device restarts.
Memory and safety. After the CRC check, the uploaded package is moved to RAM and the copy in storage is deleted if the free RAM is at least twice its size. This saves space that would otherwise be missing during unpacking. During the update the web server keeps working and the progress is sent to the browser line by line to a progress indicator (figure below); restoring factory settings is blocked in the meantime. A power failure in the middle of an update may leave a mix of old and new files; the firmware is then uploaded again over USB. The version in the form LK-30 airQ v1.8.nnn (nnn is the number of the last request in the documentation) is shown after the restart on the settings page and on the display.
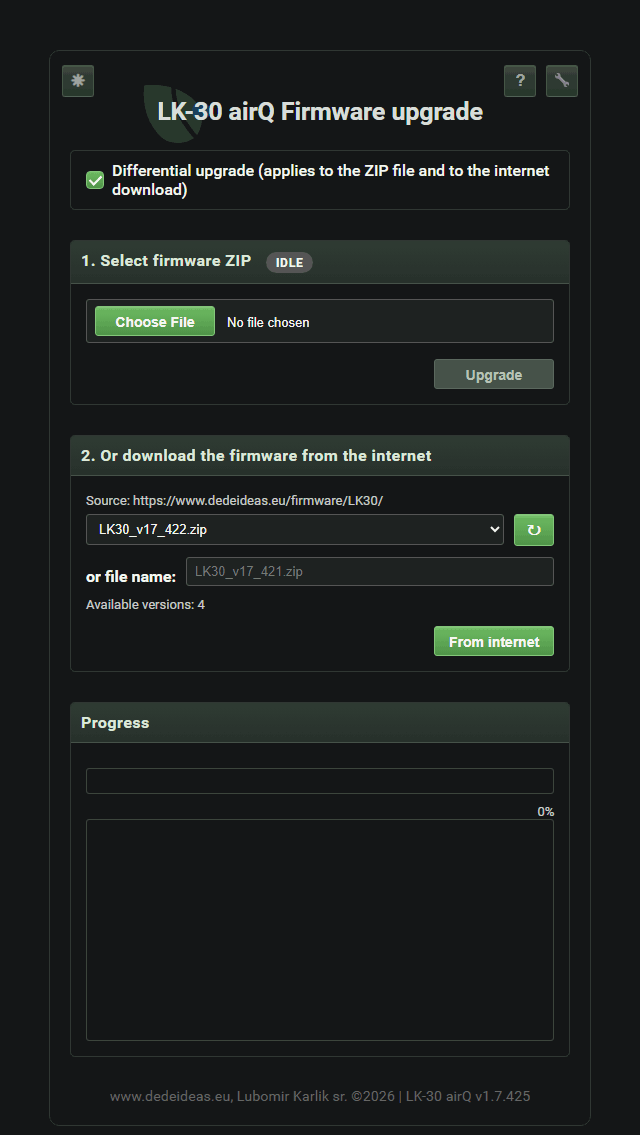 source selection |
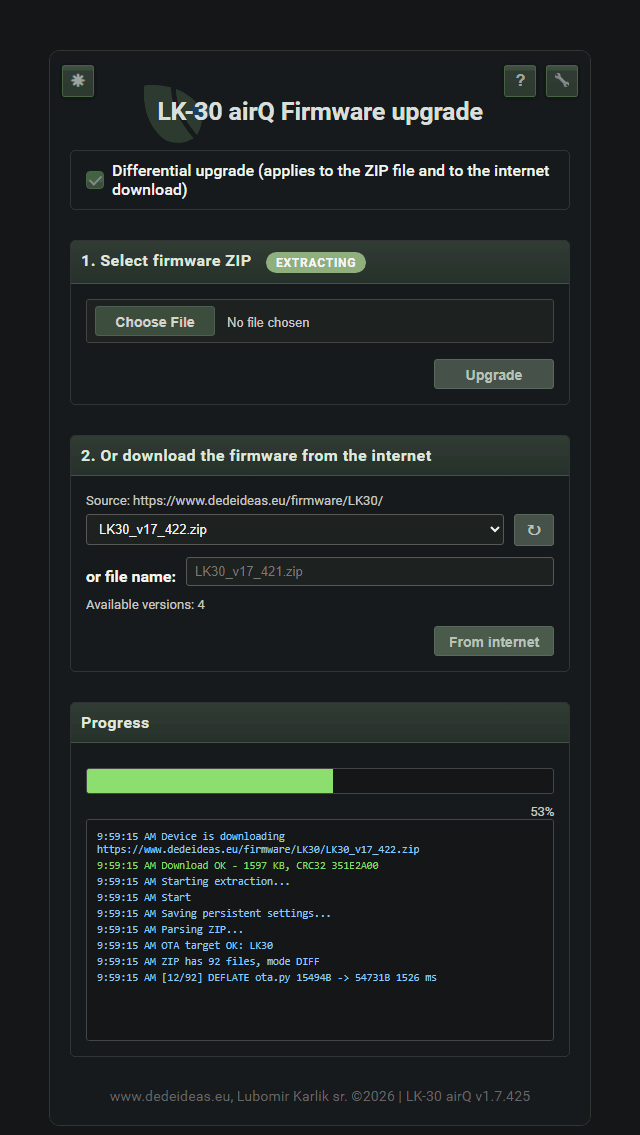 update progress |
Fig. 7 – The Firmware update page: selecting a ZIP file or a package from the internet, and the update progress
First start
A device without a saved configuration creates an open Wi-Fi network named LK-30_airQ. After connecting a phone or another device to this network and opening the address 192.168.4.1, a wizard with three steps starts:
- language selection (Slovak or English)
- time and location
- Wi-Fi network setup
The second step asks for the altitude, because the pressure is converted to sea level. After saving, the device restarts and connects to the home network. The IP address is shown on the e-paper display of the ESP32-S3 module.
Display and web interface
The e-paper display permanently shows the main screen with the IAQ value, the verbal rating and the CH4 gas concentration. It retains the image even without power and its consumption is negligible, at the price of slow redrawing: a short flash at refresh is normal. Besides the main screen, screens for the gas sensor, device information, the I2C bus, the database status, Wi-Fi and a service screen are available; they are switched by swiping a finger. The following images show what the individual screens of the e-paper display show.
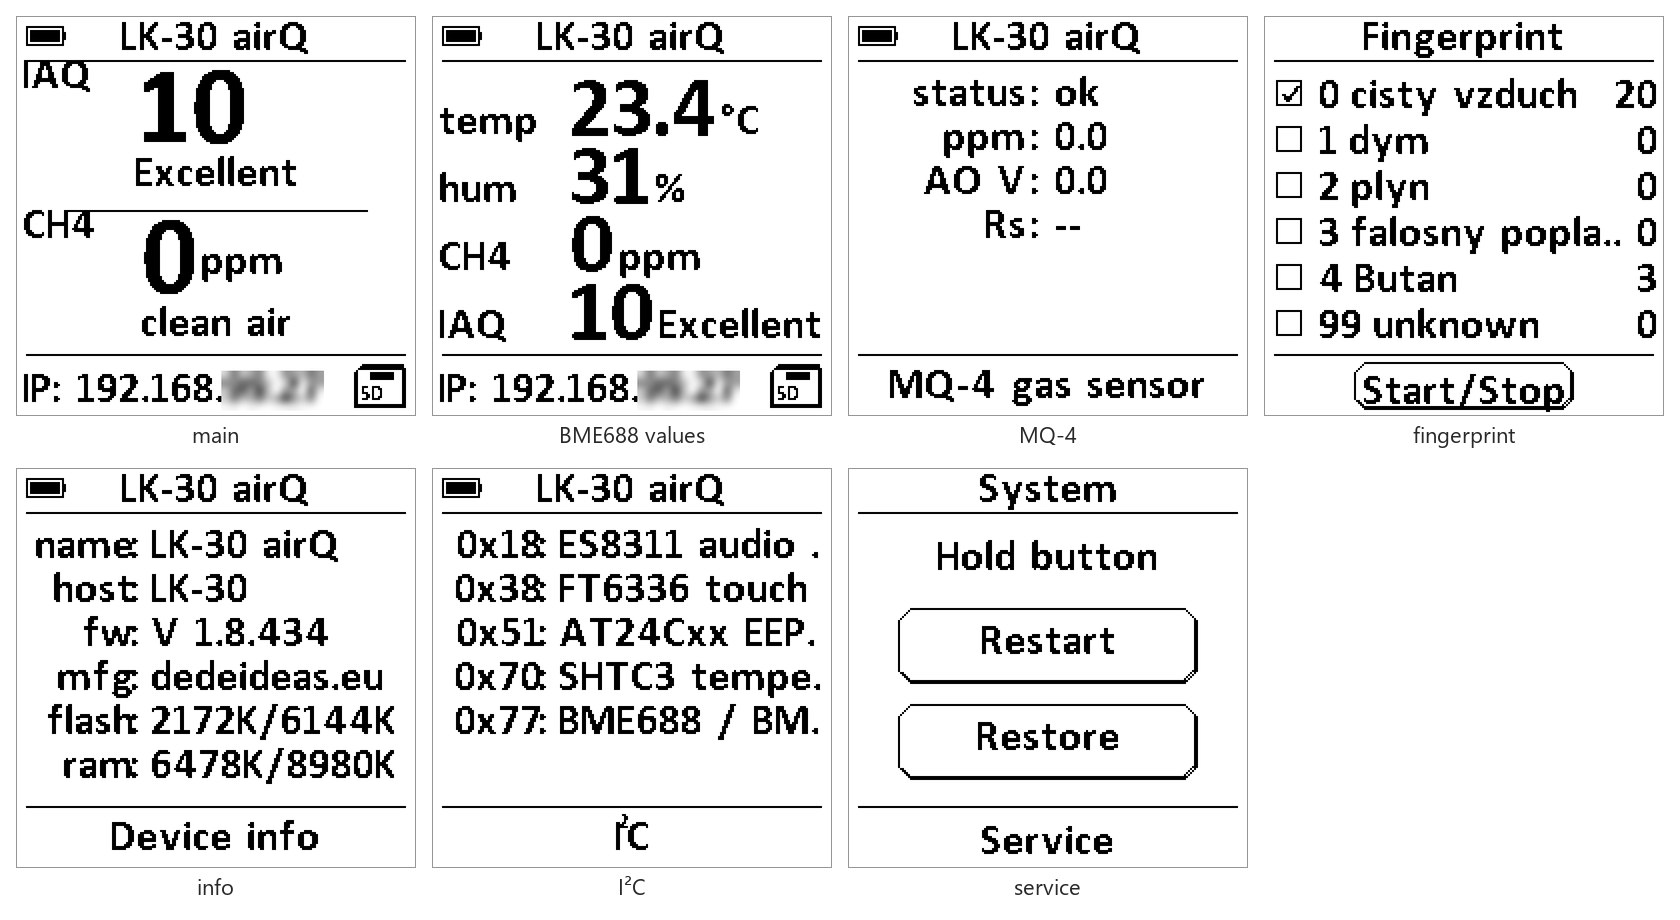
Fig. 8 – Screens of the e-paper display: main, BME688 values, MQ-4 gas sensor, class selection for fingerprint, device information, I²C bus and the service screen with the Restart and Restore buttons
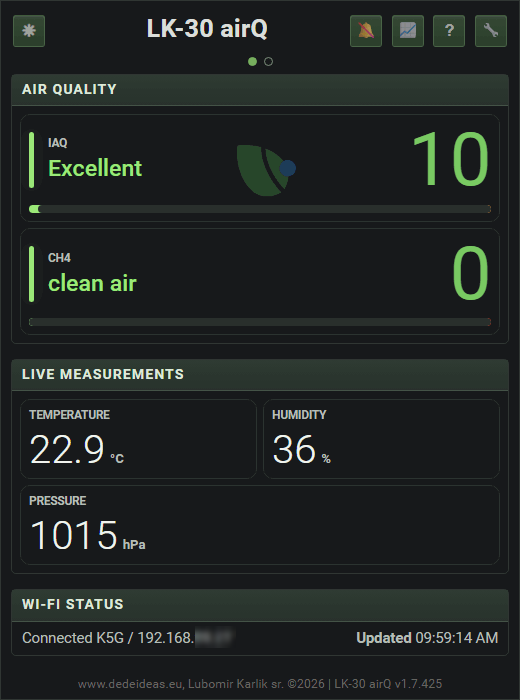
Fig. 9 – The main page in a web browser
The main web page of the device shows the same and in addition the temperature, humidity, pressure, device time and date, the Wi-Fi status and a history chart. The service pages (settings, firmware update, Wi-Fi, console) can be protected with a password; the login name is permanently “admin” and cannot be changed. There is also a web help that reads the text of the user manual directly from the device.
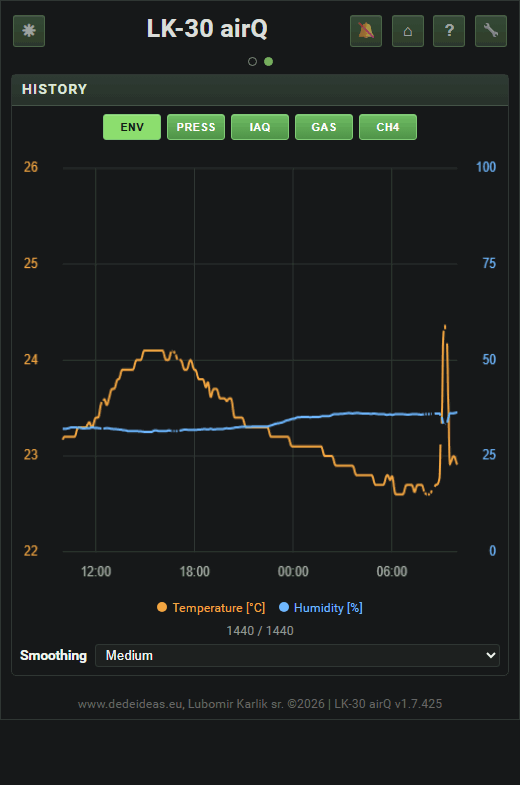
Fig. 10 – Chart of the measurement history; by dragging the mouse you can select the section in which the IAQ rose
Alarm
The device has an audio output (ES8311 codec) and announces three kinds of events, besides signalling touch:
- worsened air: IAQ above a threshold (the default is 100),
- gas leak: the MQ-4 concentration above a threshold (the default is 300 ppm),
- high temperature: from 50 °C.
At each event the display is redrawn first and only then does the siren sound, which can be stopped at any time by a longer touch of the display. The alarm can also be switched on in the browser (bell icon).
What the BME688 can and cannot do
The BME688 gas sensor is not selective: the measured resistance changes with various volatile substances, smoke or even cooking. The IAQ value is therefore only indicative. The index is calculated against a reference resistance value in clean air (baseline), which the firmware maintains by itself, even with slow sensor drift. The automatic adjustment is blocked at high humidity (above 65 %) and at a fast change of humidity, so that the device does not learn rain, or humid air from cooking or washing, which significantly affects the conductivity of the sensitive layer of the sensor, as “clean air”.
An interesting function is the “fingerprint”. During measurement the BME688 is cyclically heated to several temperatures (the heating profile of the heating element of the sensor) and the resistance at each step forms a vector, the “fingerprint” of the air. The user can collect samples into classes (clean air, smoke, gas, false alarm,...) and when the IAQ rises, the device compares the current vector with the stored samples. The shape of the curve is compared, not the absolute level, so the concentration does not matter. The result, the class name and the confidence in percent, is shown on the main page. When a rise occurs without being recognised, a sample can be assigned to a class from the record in the chart, so the device can learn to recognise unknown kinds of gases (smells).
IAQ calculation and its compensations
The BME688 sensor does not measure the concentration of any substance. It measures only the electrical resistance of a heated metal-oxide (MOX) layer, which drops when volatile substances oxidise on it. However, the resistance also depends on humidity, temperature, the age of the sensor and the particular unit. The IAQ index is therefore not calculated by the manufacturer's library but by a custom algorithm in MicroPython, and it has no relation to the IAQ value calculated by the official Bosch software library; do not confuse them. Most of the work of the algorithm consists of compensating for these influences (figure below and the table at the end of the chapter).
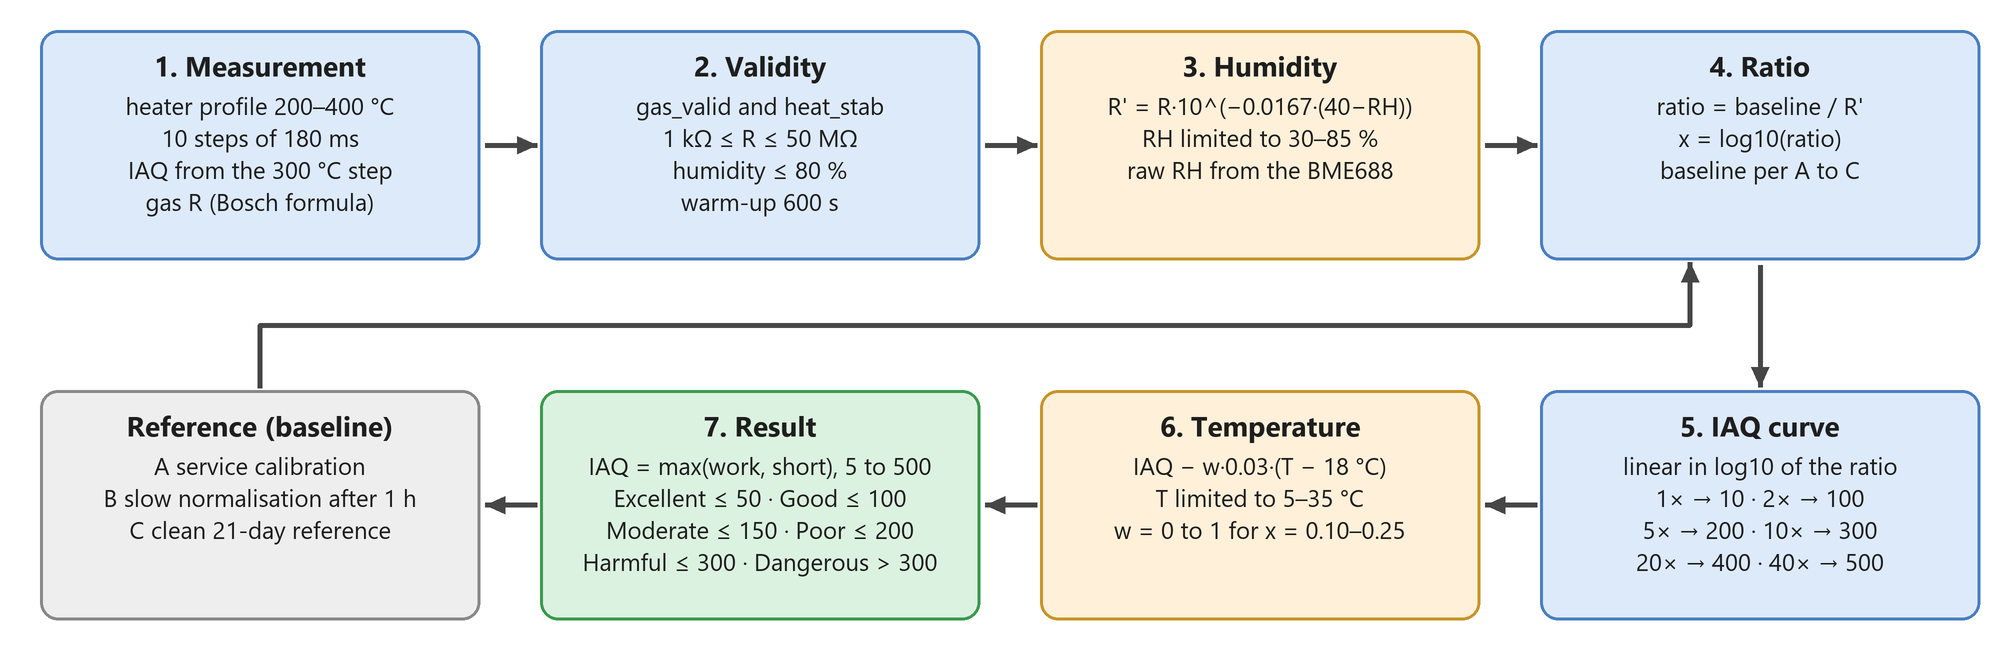
Fig. 11 – IAQ calculation procedure: validity of the measurement, humidity compensation, ratio to the reference, IAQ curve, temperature correction
Measurement and validity
In each measurement the heater of the gas sensor runs through a profile of ten steps with temperatures from 200 to 400 °C, 180 ms each. The IAQ value is taken from the step at 300 °C; the other steps are used for substance recognition (next chapter). Temperature, humidity and pressure are measured separately with the heater switched off, with a sufficient time gap. The gas resistance is calculated with the full manufacturer formula, including the range-switching calibration constant and the tables for the individual ranges. A simplified calculation caused regular jumps at each range switch, which were visible in the chart as “teeth”.
A measurement is not used if the sensor does not report a valid result and stable heating (the bits gas_valid and heat_stab), or if the resistance lies outside the range 1 kΩ to 50 MΩ; in that case “unstable measurement” is shown and the IAQ is not calculated. If humidity exceeds 80 %, for example after rain or in condensation, the humidity compensation is no longer reliable and the IAQ is suppressed (“out of range”) rather than show a misleadingly bad value. After switching on, the device waits 600 s for the sensor to warm up (after a soft restart the wait is skipped). The first cycle after start-up is not discarded: its temperature is compensated in the same way as in the other cycles.
Humidity compensation
The resistance of the gas sensor depends strongly on humidity. Before the ratio is calculated, the resistance is therefore converted to the value the sensor would have at a reference humidity of 40 %:
\[ R′ = R \cdot {10}^{s \cdot \left( {\mathrm{RH}}_{\mathrm{ref}} - \mathrm{RH} \right)} \]
where s = −0.0167 per percent of relative humidity and RH is the humidity limited to the range 30 to 85 %. The coefficient was derived empirically on the older LK-29 device and taken over. The raw humidity measurement from the BME688 is used, that is, the humidity at the gas sensor itself, not the value corrected for the heating of the case.
Conversion to the IAQ index
The ratio and from it the IAQ are calculated from the relation between the reference resistance (baseline) and the current resistance R'. The interpolation is linear in the logarithm of the ratio, not in the ratio itself, because the change of resistance is approximately logarithmic with respect to the real concentration. Linear interpolation in the ratio squeezed almost the entire range into the first segment and amplified noise. The fixed points are: ratio 1× corresponds to IAQ 10, 2× to 100, 5× to 200, 10× to 300, 20× to 400 and 40× to 500. The result is limited to 5 to 500. The verbal rating has six levels with adjustable thresholds; by default it is up to 50 Excellent, up to 100 Good, up to 150 Moderate, up to 200 Poor, up to 300 Harmful and above 300 Dangerous. The thresholds (IAQ_LEVEL_1 to IAQ_LEVEL_5) are set on the BME688 page in the “IAQ rating” section, as is the text of each level, which can be reset to the supplied wording. The internal name of the level in the device remains English (Excellent to Dangerous), so the e-paper display shows the English names, while the web interface shows them in the language of the page.
Temperature correction
After the humidity compensation a small temperature influence remains. It is corrected by the relation:
\[ \mathrm{IAQ} - w \cdot 0.03 \cdot \left( T - 18 \,^{\circ}\mathrm{C} \right) \]
where T is the raw temperature from the BME688 limited to 5 to 35 °C. The weight w grows linearly from 0 at a log10 ratio of 0.10 to 1 at 0.25. In clean air the IAQ is therefore not shifted and the correction applies only when the resistance really drops.
Clean-air reference (baseline)
The ratio is calculated against the resistance the sensor gives in clean air. This resistance is different for every unit and changes over time, so it is maintained by three mechanisms:
- A. Service calibration. in clean air after warm-up, two consecutive values are taken and their average is saved as the reference. If the pair differs by more than 5 %, it is discarded and the next pair is taken,
- B. Slow normalisation. when the air has been calm for at least an hour (no event, which is IAQ from 60 together with a fast resistance drop of 12 % or more; humidity at most 65 % and a change between samples of at most 3 %), the reference is moved to the current value by the same pair test (5 %). Any event or change of humidity cancels the calm window, so rain or a humid transient state is not learned as clean air,
- C. Clean 21-day reference. the highest trusted resistance (after humidity compensation) over the last 21 days, recorded only at IAQ below 60. The long-term IAQ is calculated from it, and the resistance is normalised to a common value of 250 kΩ so that vectors from different sensors are comparable. After a change of the resistance calculation it can be recalculated by force.
Note on mechanism B: the calm window is interrupted only by a pronounced event or a change of humidity. A very slow worsening of the air (for example an hour of cooking without a fast drop of resistance) does not interrupt it, so after an hour the current resistance may be accepted as the new reference. The IAQ then drops abruptly although the air is not better; the long-term IAQ against the 21-day reference (mechanism C) has no such jump.
The device thus calculates three values: the short-term IAQ (against the baseline, used to decide on an event), the working IAQ (after a possible baseline update in the same cycle) and the long-term IAQ (against the clean 21-day reference, diagnostic). The larger of the short-term and the working one is displayed.
Long-term trend and sensor drift
A slow worsening of the air can be mistaken for ageing of the sensor. The trend module therefore builds a 24-hour clean-air vector from the normalised resistance (the median of hourly bins, at least 5 measurements in each) and continuously compares it with the median of the last 24 hours. A drop of 5 % is marked “watch”, 10 % slow deterioration and 20 % pronounced deterioration. If the drop is between 5 and 10 % and the shape of the 24-hour curve differs from the reference by at most 8 %, it is evaluated as possible sensor drift, not pollution. Collection of the reference is paused during an event (IAQ from 60) and during fingerprint sample collection, so that values from a different heating profile do not get into it.
Compensation of temperature, humidity and pressure for display
The case is heated by the electronics and the MQ-4, so the BME688 shows a slightly higher temperature. The board therefore carries an SHTC3 thermometer, which however sits right next to the heat sources and shows much more; it is not used as a reference but as a measure of the heating of the board:
\[ T = {T}_{\mathrm{BME}} - K \cdot \left( {T}_{\mathrm{SHTC3}} - {T}_{\mathrm{BME}} \right) \]
with K = 0.15 and the correction limited to 5 °C. SHTC3 readings older than 180 s are ignored. The relative humidity is converted to the corrected temperature so that the absolute humidity is preserved (the Magnus formula for saturated vapour). The IAQ calculation uses the uncorrected values, because the gas sensor works in the real conditions inside the case. The pressure is converted to sea level according to the entered altitude. For the chart an additional smoothing (median and Hampel filter) is used for display; it changes only the picture, not the measured values.
| Source of error | Measure | Applied to |
| Range switching and chip calibration | full manufacturer formula with tables | gas resistance |
| Unstable heating, invalid measurement | gas_valid, heat_stab, 1 kΩ to 50 MΩ |
IAQ is not shown |
| Sensor warm-up | 600 s | IAQ, sample collection |
| Humidity (cross-sensitivity) | \(R \cdot {10}^{- 0.0167 \cdot \left( 40 - \mathrm{RH} \right)}\); above RH 80 % the IAQ is suppressed | gas resistance |
| Temperature | −0.03 IAQ per °C above 18 °C with a weight of 0 to 1 | IAQ |
| Differences between units | baseline A to C, normalisation to 250 kΩ | IAQ, vectors |
| Ageing (drift) | 21-day reference, 24-hour trend and shape | long-term IAQ, trend |
| Heating of the case | \(T - 0.15 \cdot \left( {T}_{\mathrm{SHTC3}} - T \right)\), at most 5 °C, RH conversion | displayed T and RH |
| Altitude | pressure converted to sea level | pressure |
Substance recognition: fingerprint and the k-NN method
The device has no neural network, although I originally planned one, but the requirements for the number of samples and the memory requirements of processing large amounts of data are not suitable for this device, so I gave it up. A comparison of classifiers on a PC (Random Forest, a small neural network and k-NN on the same data) showed no benefit on the data so far, because there are still too few samples. To recognise the type of event (smoke, gas, butane and so on) it uses the k-nearest neighbours method (k-NN), written directly in MicroPython. The reasons are practical: the method needs only tens of labelled samples, has no training phase (learning is adding a sample), is explainable (the result can be compared with concrete samples) and has low memory and processor consumption. Deploying the emlearn library and a Random Forest type model was originally planned only after collecting a sufficient amount of labelled data and will not be used in the device, for the reasons given above.
Fingerprint of the air
In every measurement the resistance at all ten heating steps is measured, giving a vector of ten numbers R1 to R10. Different substances react differently at different temperatures, so the shape of this curve is characteristic of a given substance. The absolute values, however, differ for every chip, so the vector is divided by the clean-air reference vector:
\[ {r}_{i} = 1000 \cdot \frac{{R}_{i}}{{C}_{i}} \]
In clean air each component is therefore around 1000, and reducing gases lower it.
The clean-air reference vector belongs to a particular sensor. It comes from manually collected samples of the clean-air class, or the device maintains it by itself: if the IAQ is at most 10, the short-term IAQ below 60 and the values are valid continuously for 30 minutes, the reference is mixed once an hour with the current vector:
\[ \text{new} = 0.95 \cdot \text{old} + 0.05 \cdot \text{current} \]
The reference is marked as manual, automatic or mixed; after 21 days it is considered old.
The k-NN algorithm
For one event the device performs these steps:
- The current vector is converted to a relative one and divided by its own average, so only the shape of the curve is compared, not the overall signal level, and the concentration of the substance does not affect the result.
- Every stored sample of the training set (the newest 600 at most) is adjusted in the same way.
- The distance to a sample is the mean absolute percentage deviation \(\displaystyle d = \frac{100}{n} \cdot \sum_{i = 1}^{n} \frac{\left\lvert {a}_{i} - {b}_{i} \right\rvert}{{b}_{i}}\).
- The samples are sorted by d and the 3 nearest are selected (k = 3).
- For each class among them, the votes and the distance of the nearest sample of that class are counted. The class with the most votes wins; in a tie, the one with the smaller distance.
- The confidence in percent is \(\displaystyle \frac{\text{votes}}{k} \cdot \max \left( 0 ;\, 1 - \frac{4 \cdot d}{100} \right) \cdot 100\). A match d = 0 gives 100 %, a deviation of 25 % already 0 %.
For the confidence, the distance of the nearest sample of the class is taken, not the average. A class that contains the same substance at several concentrations or phases (rise, peak, decay) is multimodal, and one different sample should not lower the score of an event that matches another sample exactly. For butane the deviations of the nearest samples were 8.6 % and 25.7 %; the average would give a confidence of 31 %, the nearest sample 66 %.
Triggering and evaluating an event
Classification starts when the IAQ exceeds 30 after warm-up, no calibration or sample collection is running and at least 10 minutes have passed since the last event. The vector that has already been produced in the regular measurement is used, so no special scan or pause is needed. The result with the class name and confidence is shown on the main page and held until the IAQ drops to about half of its maximum. If the confidence is below 40 % and the nearest class is protected (clean air or unknown), a verbal rating (“mild” or “strong unknown pollution”) is shown instead of a misleading name. For a user-created class the name and the low confidence are always shown, because they indicate which class needs more samples. Each snapshot is stored in a log of the last 50 events together with the IAQ, temperature, humidity and pressure at the time of the event, so that it can be verified in the evaluation whether the model is not learning humidity instead of gas.
Learning and limitations
Learning consists of collecting samples. The user selects a class and starts collection, or marks in the chart a section in which the IAQ rose and assigns the recorded event to a class without a new collection. The samples are first stored in RAM and written to storage only on save; the dataset is in the files bme688_meta.json (classes, profiles) and bme688_samples.jsonl (samples), which are not deleted during a firmware update. The samples can be exported and imported. After an evaluation the temporary memory is released (the calculation creates about 120 KB of small objects).
The method is only as good as its samples. Distinguishing substances requires samples in several classes, including clean air, and for each at least at a few concentrations; a class with a single sample attracts all events. The samples are valid for a particular heating profile and a particular sensor; after a change of the profile or after a forced recalculation of the clean reference the samples must be collected again. The BME688 is not a laboratory analyser and the result is only a probabilistic estimate.
MQ-4 gas sensor
After switching on, the MQ-4 needs time to warm up, during which the display reports “warming up”. The concentration is calculated from the voltage of the analogue output: a very low voltage in clean air corresponds to 0 ppm, a voltage close to saturation corresponds to the set ceiling. In clean air the output is only a few tens of mV, so a value of 0 or a few tens of ppm is noise, not gas. When powered from a battery the MQ-4 is switched off by default, because the battery voltage does not match the calibrated 5 V supply and the result would be distorted.
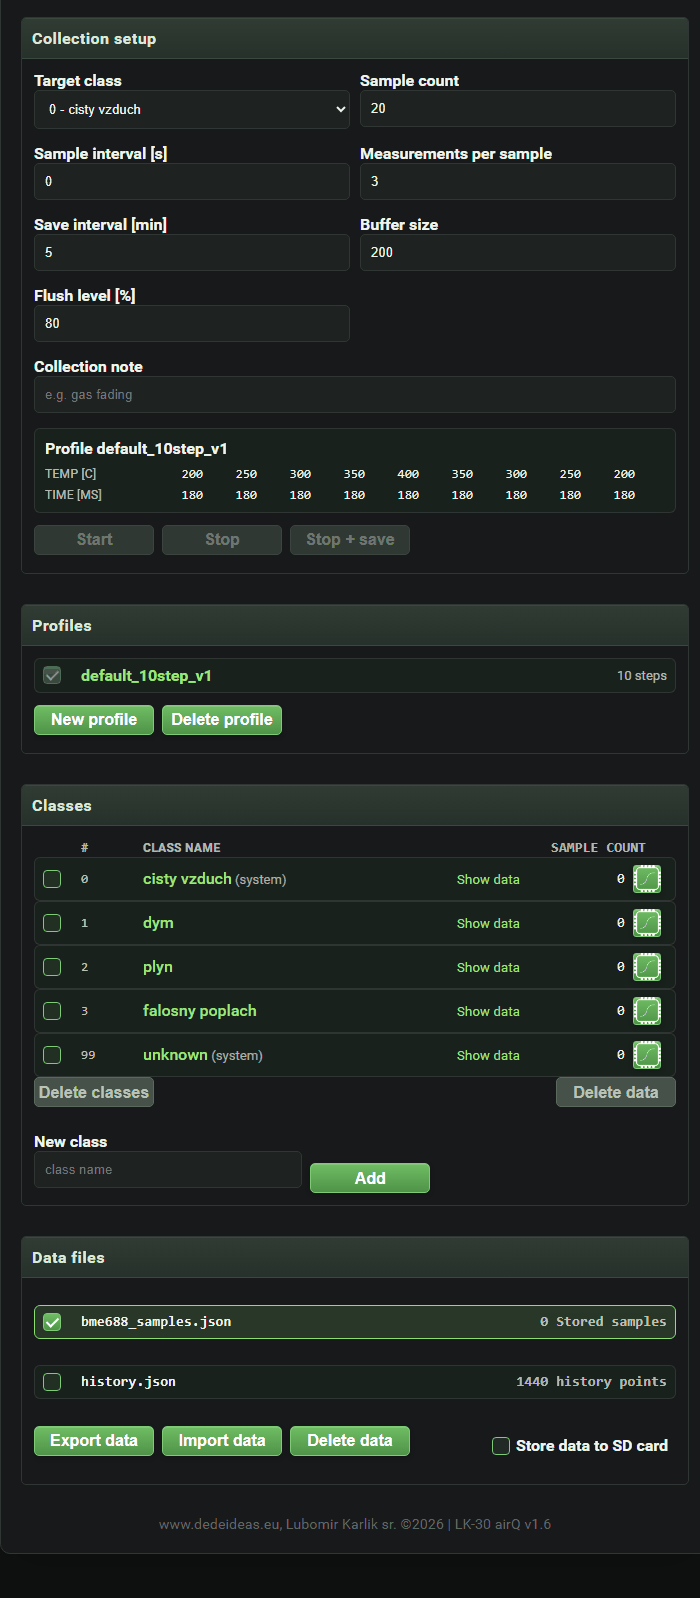 Fig. 12 – BME688 fingerprint: heater profiles, classes and data files |
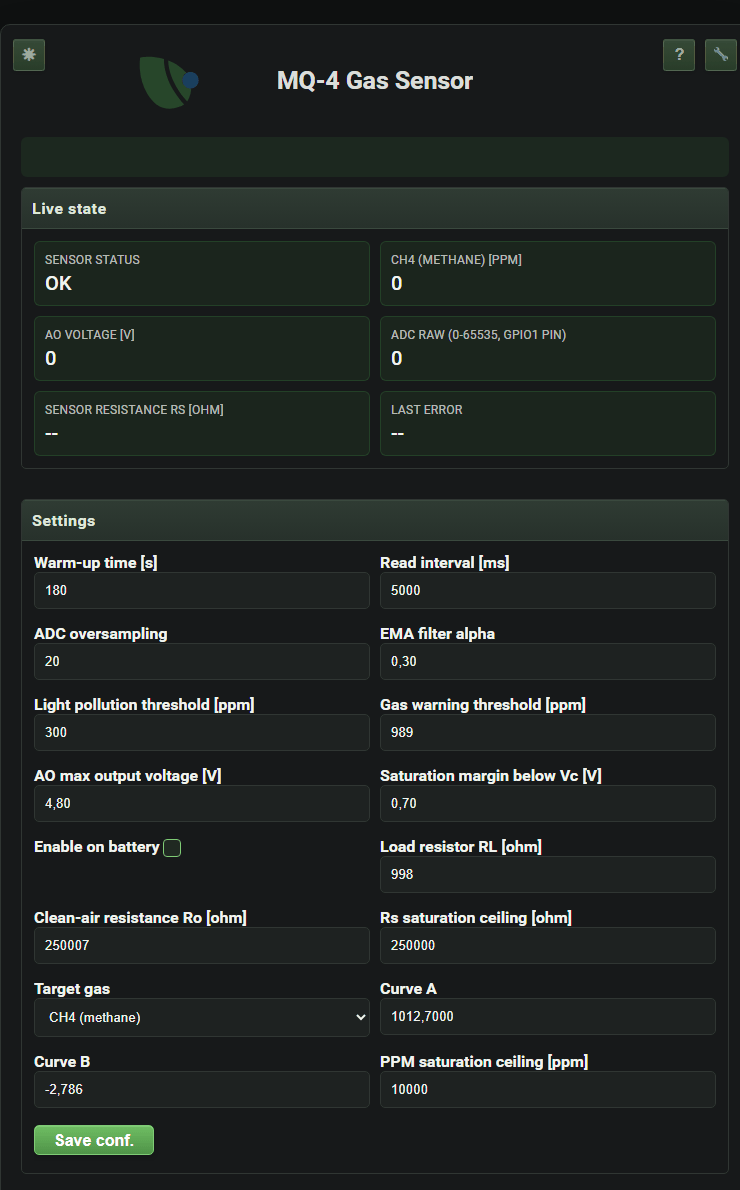 Fig. 13 – The MQ-4 page: live values and measurement settings |
Important notice: the device is not a certified gas leak detector or a medical meter and does not replace a separate detector certified for this purpose and regularly calibrated.
Other functions
- SD card (FAT32): file manager in the web interface, backup of configuration and data.
- Firmware update (OTA) from a ZIP file or directly from the internet, also differential.
- Optional logging of measurements to an InfluxDB database.
- Restoring factory settings confirmed on the display.
- User interface in Slovak and English.
Conclusion
The LK-30 airQ is an attempt at a compact, quiet and unobtrusive monitor that can be mounted on a wall and needs no attention after the Wi-Fi is set up. Most of the work was not in the hardware but in the software. For the sensor to give correct data, it was necessary to introduce temperature compensation, to maintain the clean-air reference despite all kinds of drift, and to make sure the alarm does not sound needlessly. The project is still under development.
References
- Bosch Sensortec: BME688 datasheet (bst-bme688-fl000).
- Waveshare: ESP32-S3-ePaper-1.54, docs.waveshare.com/ESP32-S3-ePaper-1.54.
- MQ-4 methane sensor, datasheet.
- MicroPython, micropython.org.